
Page 5 - Suppressed ion-scale turbulence in a hot high-beta plasma
P. 5
053512-5 Matsumoto et al.
g and c are 245 ⇥ 102 and 215, respectively. Hence, the
MCPG satisfies the condition for CT ejection.
B. Experimental results
The MCPG was normally operated with Vgun, Vbias and gas pressure set to 20 kV, 300 V, and 40 psia, respectively. The velocity of the ejected CTs is one of the most important parameters for CT injection into FRCs because the kinetic energy of the CTs has to be higher than the magnetic field energy in the confinement region, i.e., Ek = mv2/2 > B2/2μ0, where m is the mass of the ejected CT, v is the velocity, and B is the magnetic field surrounding the FRC. Photo-diodes were used to measure the velocity of the CTs in the test chambers. Typical waveforms of the photo-diodes are shown in Fig. 6. Photo-diode #1 is mounted on the 100 mm test chamber and the other photo-diodes (#2–#6) are on the 366 mm test chamber as shown in Fig. 4. Port-to-port intervals are 37 cm (#1–#2), 37 cm (#2–#3), 37 cm (#3–#4), 21 cm (#4–#5), and 18 cm (#5–#6), respectively. Figure 6 shows typical waveforms for each photo-diode. The velocity was calculated based on the measurements from peaks between ports #1 and #2. The estimated CT velocity was approximately ⇠100 km/s, and slowing down as the CTs translate into the large test chamber.
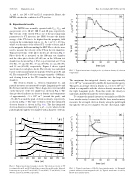
The electron density ne, electron temperature Te, and particle inventory are measured by triple Langmuir probe and He-Ne laser interferometry. These diagnostics were installed on the first port of the test chamber as shown in Fig. 4. The data produced indicate an electron density and temperature of approximately ⇠5 ⇥ 1021 m 3 (around the peak), and ⇠35–40 eV around the peak of electron density, respectively, as shown in Fig. 7. The time evolution of the line-integrated electron density is shown in F⇤ig. 8(a). The line-integrated electron density is estimated by nedl ⇠ hneiL, where L is the path length through the test chamber with a diameter of 10 cm.
Rev. Sci. Instrum. 87, 053512 (2016)
FIG. 6. Typical waveforms from photo-diodes. The ejection velocity of CT is estimated from #1 and #2. Dashed lines connect the profile peaks. Intervals between port to port are 37 cm (#1-#2), 37 cm (#2-#3), 37 cm (#3-#4), 21 cm (#4-#5), and 18 cm (#5-#6), respectively.
FIG. 8. Typical waveforms of He-Ne laser interferometer. (a) Estimated particle inventory from integrated nedl. (b) Typical waveforms of nedl by He-Ne laser interferometer.
FIG. 7. Typical waveforms of triple probe: (a) electron density, (b) electron temperature.
The maximum line-integrated density was approximately 4.9 ⇥ 1020 m 2 as measured by the He-Ne laser interferometry. This gives an average electron density hnei of 4.9 ⇥ 1021 m 3 which is comparable with the electron density measured by the triple Langmuir probe. From this result, the density is uniformly distributed inside the ejected plasmoid.
To estimate the particle inventory, we mainly used He-Ne laser interferometry because the He-Ne laser interferometry measures the averaged electron density along the path length through the 10 cm test chamber. On the other hand, triple
