
Page 4 - Particle and heat flux diagnostics on the C-2W divertor electrodes
P. 4
10J110-4
Griswold et al.
Rev. Sci. Instrum. 89, 10J110 (2018)
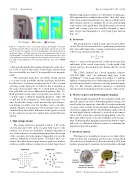
FIG. 10. (a) Quarter-section of an energy analyzer showing SS 316 in gray and alumina in white. Metal components around triple point junctions (circled in red) are shaped to minimize electric field magnitude at the junction between metal and ceramic. (b) Finite element electrostatic simulations of the electric field magnitude, showing that the peak in electric field magnitude at the corner of the grid frames is reduced compared to the design shown in (c) by the “chef’s hat” shaped ring. Simulations were performed with the open source FEMM software.
as they pass through the mirror plug and expander, so the veloc- ity vector of any ion that arrives at the energy analyzer from the core should be less than 20◦ from parallel to the magnetic field).
The attenuation grids have one further design element to account for the possibility that the grid holes will slowly be filled in by a titanium coating from the C-2W’s vacuum gettering system. Each pair of analyzers that is mounted on the same electrode plate (Fig. 6) is fitted with an attenua- tion grid with one of two different hole patterns (Fig. 11). Both patterns have the same total aperture area, but the con- ical holes taper to different minimum diameters: either 100 or 200 μm. If the transparency of the grids decreases over time, the absolute change can be measured by optical inspec- tion during a machine vent, but machine vents occur infre- quently. Changes in transparency between inspections can be estimated from the relative difference in the signals received by the analyzers because the smaller holes should fill more quickly.
3. High voltage design
The energy analyzer is designed to hold −1 kV on the electron grid and +4 kV on the ion grid, with respect to the analyzer case. It was also desirable to minimize the physical size of the analyzer to avoid perturbing the plasma (the design of the concentric electrodes makes it impossible to recess the analyzers behind the electrode plates). To balance these con- straints, the radial and axial gaps between grids were made as small as possible without creating electric fields larger than 1
kV/mm along insulator surfaces or 3 kV/mm in vacuum gaps. All components have rounded edges and the “chef’s hat” shape of the electron and ion grid frames was chosen, with the aid of finite element software, to minimize the electric field strength at the corners of the grid frames. Finally the interface between metal and ceramic parts was carefully designed to mini- mize electric field magnitudes at every triple point junction (Fig. 10).13
D. Bolometer
The pyrobolometer is built around a pyroelectric LiTaO3 crystal. Pyroelectric materials have a permanent polarization that varies with temperature, causing a polarization current Ip to flow in an external circuit (Fig. 12),
Ip= γ ×Q, cρδ
where γ, c, and ρ are the pyroelectric coefficient, specific heat, and density of the crystal, respectively, δ is the width of the crystal, and Q is the incident power density that the crystal absorbs.14
The LiTaO3 material has a broad frequency response (100–200 kHz) and can withstand high heat loads (20 MW/m2).15 Our design follows that of Ref. 15, with the addition of springs that were found empirically to isolate the crystal from mechanical vibration caused by pulsed magnets (Fig. 12). The vibration otherwise introduces a substantial amount of noise from the piezoelectric response of the crystal.
E. Thermocouples and thermographic imaging
Thermographic imaging of the electrode plates with a fast infrared camera to provide 2-D heat flux profiles is being eval- uated, but the low emissivity of metallic electrodes and nearby cryogenic surfaces make the measurement challenging. Each electrode is equipped with two type E thermocouples (chosen for their high Seebeck coefficient) to track electrode temper- atures as they warm due to plasma heating during a run day. These data will be used to assess the feasibility of the measure- ment. If thermographic imaging is pursued, the thermocouples will serve as calibration reference points for estimating the plasma heat deposition profile.
F. Electrical system
The diagnostics’ mounting location poses a technical chal- lenge for their data acquisition and electronics system. Each electrode plate is designed to be biased as much as 5 kV from machine ground and to maintain electrical insulation through
FIG.11. Twoholepattersusedfortheenergyanalyzerattenuationgrids.
FIG.12. DesignofthepyrobolometerinstalledinC-2W.
