
Page 5 - Calibration and applications of visible imaging cameras on the C-2U advanced beam-driven field-reversed configuration device
P. 5
10E103-5 Granstedt, Fallah, and Thompson
Rev. Sci. Instrum. 89, 10E103 (2018)
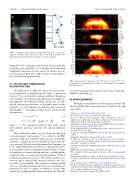
FIG. 8. (a) Radial camera image of neutral beams fired into a gas target. Apparent curvature of the trajectories is due to lens fisheye distortion. (b) Normalized viewport transmission variation over run campaign.
during the C-2U campaign, neutral beams were periodically fired into a gas target [Fig. 8(a)]. Changes in the measured unshifted Dα emission served as a proxy for changes in view- port transmission [Fig. 8(b)], with error-bars corresponding to the variation from separate beams.
IV. APPLICATION: TOMOGRAPHIC RECONSTRUCTION
One application of calibrated camera data was emissiv- ity reconstruction of impurity spectral lines. A projection matrix (P) was calculated by tracking sight-lines through an axis-symmetric reconstruction grid. Gaussian smoothing was then applied to the calibrated radiance image data (b). Tak- ing the back-projected radiance as the initial guess for the emissivity (ε 0 ), the Simultaneous Algebraic Reconstruction Tomography14,15 algorithm was then used to iteratively find the emissivity
ε
FIG. 9. Reconstructed emissivity of the 650 nm line from the O4+ 3d → 3p transition, overlaid with the calculated r∆Φ from magnetics and inferred X-point locations.
reconstructed emissivity provided a sanity-check on the algo- rithm for calculating r ∆Φ .
ACKNOWLEDGMENTS
We thank our shareholders for their support and trust and all fellow TAE staff for their dedication, excellent work, and extra efforts.
1H. Gota et al., Nucl. Fusion 57, 116021 (2017).
2P. G. Carolan et al., Rev. Sci. Instrum. 75, 4069 (2004).
3F. Scotti, “Modifications of impurity transport and divertor sources by
lithium wall conditioning in the National Spherical Torus Experiment,”
Ph.D. thesis, Princeton University, Princeton, NJ, 2014.
4J. Harhausen, A. Kallenbach, C. Fuchs, and ASDEX Upgrade Team, Plasma
Phys. Controlled Fusion 53, 025002 (2011).
5E. M. Granstedt, P. Petrov, K. Knapp, M. Cordero, and V. Patel, Rev. Sci.
Instrum. 87, 11D416 (2016).
6J. Kannala and S. Brandt, IEEE Trans. Pattern Anal. Mach. Intell. 28, 1335
(2006).
7G. Bradski, Dr. Dobb’s Journal of Software Tools, 2000.
8F. Wang and A. Theuwissen, Electronic Imaging, Image Sensors and Imag-
ing Systems (Society for Imaging Science and Technology, San Francisco,
CA, 2017), Vol. 2017, pp. 84–90.
9LUPA1300-2: High Speed CMOS Image Sensor, ON Semiconductor, 11th
ed., 2011.
10 EDR—Extreme Dynamic Range, Vision Research, 2012.
11M. A. Robertson, S. Borman, and R. L. Stevenson, J. Electron. Imaging 12,
219 (2003).
12M. Ghodrati, A. P. Morris, and N. S. C. Price, Front. Psychol. 6, 303 (2015). 13A. Badano, M. J. Flynn, S. Martin, and J. Kanicki, Med. Phys. 30, 2602
(2003).
14A. H. Andersen and A. C. Kak, Ultrason. Imaging 6, 81 (1984).
15W. Meyer, M. Fenstermacher, and M. Groth, in 56th Annual Meeting of the
APS Division of Plasma Physics, Bulletin of the American Physical Society
Vol. 59 (American Physical Society, 2014).
16T. Roche et al., Rev. Sci. Instrum. 87, 11D409 (2016).
ε0=ε =PT·b, BP
(3a) =ε +λ P ·FHP b−P·ε , (3b)
k+1 k T k
where λ is the relaxation parameter that trades speed with stability and FHP represents the optional high-pass filter.
calculated axial r
residual reconstruction error was ∼10%. Artifacts in the recon- struction appear when plasma emission extends to the cam- era field-of-view boundary. The emissivity generally peaked near r∆Φ, including situations where the r∆Φ calculation was non-trivial because it required accounting for vessel eddy current decay and transiently driven external coils. Thus the
The excluded flux radius (r∆Φ) is a calculated value from 16
external magnetic field sensors. It is related to the FRC separatrix radius but somewhat larger because of field-line curvature, a significant fast-ion population, and scrape-off- layer pressure. Oxygen was the dominant low-Z impurity on C-2U, and the 650 nm line from the 3d → 3p transition of O4+ was regularly used for visualizing the plasma. Figure 9 shows the emissivity reconstruction from this line, overlaid with the
∆Φ
profile from external magnetics. Typical
